Chapter 6 Web-Scraping: Polling use case
A very important metric to keep track of is how your candidate is polling. Are they gaining a lead in the polls or falling behind? This data is often reported via traditional news organizations or some other mediums. The supposed demi-God and mythical pollster Nate Silver’s organization FiveThirtyEight does a wonderful job aggregating polls. Their page National 2020 Democratic Presidential Primary Polls has a table of the most recent polls from many different pollsters.
In this use case we will acquire this data by web scraping using rvest. We will also go over ways to programatically save polls results to a text file. Saving polling results can allow you present a long term view of your candidate’s growth during the quarter.
6.1 Understanding rvest
This use case will provide a cursory overview of the package rvest. To learn more go here.
Web scraping is the process of extracting data from a website. Websites are written in HTML and CSS. There are a few aspects of these languages that are used in web scraping that is important to know. HTML is written in a series of what are call tags. A tag is a set of characters wrapped in angle brackets—i.e. <img>.
With CSS (cascading style sheets), web developers can give unique identifiers to a tag. Classes can also be assigned to a tag. Think of these as group. With web scraping we can specify a particular part of a website by it’s HTML tag and perhaps it’s class or ID. rvest provides a large set of functions to make this simpler.
6.2 Example
For this example we will be scraping FiveThirtyEight’s aggregated poll table. The table can be found at https://projects.fivethirtyeight.com/2020-primaries/democratic/national/.
Before we begin, we must always prepare our workspace. Mise en place.
library(rvest)## Loading required package: xml2##
## Attaching package: 'rvest'## The following object is masked from 'package:purrr':
##
## pluck## The following object is masked from 'package:readr':
##
## guess_encodinglibrary(tidyverse)The first thing we will have to do is specify what page we will be scraping from. html_session() will simulate a session in an html browser. By providing a URL to html_session() we will then be able to access the underlying code of that page. Create an object called session by providing the FiveThirtyEight URL to html_session().
session <- html_session("https://projects.fivethirtyeight.com/2020-primaries/democratic/national/")The next and most important step is to identify which piece of HTML code contains the table. The easiest way to do this is to open up the webpage in Chrome and open up the Inspect Elements view (on Mac - ⌘ + Shift + C). Now that this is open, click the select element button at the top left corner of the inspection pane. Now hover over the table.
You will see that the HTML element is highlighted. We can see that it is a table tag. Additionally we see that there are two different classes polls-table and tracker. To specify a class we put a preceding . to the class name—i.e. .class-name. If there are multiple classes we just append the second class name to it—i.e. .first-class.second-class. Be aware that these selectors can be quite finicky and be a bit difficult to figure out. You might need to do some googling or playing around with the selector.
To actually access the content of this HTML element, we must specify the element using the proper selector. html_node() will be used to do this. Provide the html session and the CSS selector to html_node() to extract the HTML element.
session %>%
  html_node(".polls-table.tracker")
## {xml_node}
## <table class="polls-table tracker">
## [1] <thead class="hide-mobile" id="table-header"><tr>\n<th class="new">< ...
## [2] <tbody>\n<tr class="visible-row" data-id="102929">\n<!-- Shared--><t ...Here we see that this returns on object of class xml_node. This object returns some HTML code but it is still not entirely workable. Since this is an HTML table we want to extract we can use the handy html_table(). Note that if this wasn’t a table but rather text, you can use html_text().
session %>%
  html_node(".polls-table.tracker") %>%
  html_table()
Take note of the extremely informative error. It appears we might have to deal with mismatching columns.
session %>%
  html_node(".polls-table.tracker") %>%
  html_table(fill = TRUE)
## Dates Pollster
## 1 • Sep 15-18, 2019768 LV Sep 15-18, 2019
## 2 • Sep 15-18, 20191,326 RV Sep 15-18, 2019
## 3 • Sep 15-17, 2019480 LV Sep 15-17, 2019
## 4 • Sep 14-17, 2019603 LV Sep 14-17, 2019
## 5 • Sep 13-16, 20191,291 LV Sep 13-16, 2019
## 6 • Sep 13-16, 20191,017 LV Sep 13-16, 2019
## 7 • Sep 13-16, 2019506 LV Sep 13-16, 2019
## 8 • Sep 13-15, 20197,487 LV Sep 13-15, 2019
## 9 • Sep 10-13, 2019799 LV Sep 10-13, 2019
## 10 • Sep 10-13, 20191,302 RV Sep 10-13, 2019
## 11 • Sep 6-13, 20191,865 LV Sep 6-13, 2019
## 12 • Sep 6-13, 20193,074 RV Sep 6-13, 2019
## 13 • Sep 10-12, 20191,784 LV Sep 10-12, 2019
## 14 • Sep 7-11, 2019241 LV Sep 7-11, 2019
## 15 • Sep 9-10, 2019557 RV Sep 9-10, 2019
## 16 • Sep 9-10, 2019615 A Sep 9-10, 2019
## Sample Sample Biden Sanders Warren Harris
## 1 C+HarrisX 768 LV 34% 14% 18%
## 2 C+HarrisX 1,326 RV 27% 15% 16%
## 3 AFox News 480 LV 29% 18% 16%
## 4 BYouGov 603 LV 25% 15% 19%
## 5 Civiqs 1,291 LV 24% 14% 30%
## 6 ASurveyUSA 1,017 LV 33% 17% 19%
## 7 A-NBC News/Wall Street Journal 506 LV 31% 14% 25%
## 8 B-Morning Consult 7,487 LV 32% 20% 18%
## 9 C+HarrisX 799 LV 38% 14% 15%
## 10 C+HarrisX 1,302 RV 31% 15% 12%
## 11 C+HarrisX 1,865 LV 35% 15% 15%
## 12 C+HarrisX 3,074 RV 29% 16% 12%
## 13 Civiqs 1,784 LV 23% 15% 28%
## 14 B-GQR Research 241 LV 30% 21% 19%
## 15 B+Ipsos 557 RV 22% 16% 11%
## 16 B+Ipsos 615 A 22% 16% 11%
## Buttigieg O'Rourke Booker Yang Klobuchar Castro Gabbard Ryan Delaney
## 1 5% 5% 2% 2% 2% 1% 0% 0% 1%
## 2 4% 3% 3% 2% 3% 1% 1% 1% 1%
## 3 7% 5% 4% 3% 2% 2% 0% 0% 0%
## 4 5% 8% 3% 2% 3% 1% 1% 2% 0%
## 5 6% 7% 2% 1% 2% 1% 1% 2% 0%
## 6 6% 5% 4% 4% 3% 1% 1%
## 7 5% 7% 1% 2% 4% 2% 1% 1% 0%
## 8 6% 5% 4% 3% 3% 2% 1% 1% 1%
## 9 5% 4% 3% 1% 2% 1% 1% 0% 1%
## 10 5% 4% 3% 2% 2% 1% 1% 1% 2%
## 11 6% 5% 3% 2% 3% 1% 1% 0% 1%
## 12 5% 4% 3% 2% 3% 1% 1% 1% 1%
## 13 7% 7% 2% 1% 2% 1% 1% 2% 1%
## 14 4% 4% 1% 4% 2% 2% 1% 2% 1%
## 15 4% 4% 2% 3% 3% 1% 1% 1% 1%
## 16 4% 4% 3% 3%
## Bennet de Blasio Williamson Bullock Steyer Sestak Messam Gillibrand
## 1 1% 0% 1% 1% 1% 1% 1% 0%
## 2 1% 1% 1% 1% 1% 1% 1% 0%
## 3 1% 1% 0% 0% 0% 1% 0% 0%
## 4 1% 1% 0% 1% 1% 0% 0% 0%
## 5 0% 0% 0% 0% 1% 1%
## 6
## 7 1% 1% 1% 0% 0% 1%
## 8 1% 0% 0% 1% 1% 1%
## 9 1% 1% 1% 0% 1% 2% 0% 0%
## 10 1% 1% 1% 1% 1% 1% 1% 0%
## 11 1% 1% 0% 0% 1% 1% 0% 0%
## 12 1% 1% 1% 0% 1% 1% 1% 0%
## 13 0% 0% 0% 1% 0% 0%
## 14 0% 0% 0% 1% 0% 0% 0% 0%
## 15 0% 0% 0% 0% 1% 0% 0%
## 16
## Hickenlooper Inslee H. Clinton Bloomberg M. Obama Brown Moulton Gravel
## 1
## 2
## 3
## 4
## 5
## 6
## 7
## 8
## 9
## 10
## 11
## 12
## 13
## 14
## 15
## 16
## Swalwell Kerry Abrams Holder McAuliffe Winfrey Ojeda Trump Cuomo
## 1
## 2
## 3
## 4
## 5
## 6
## 7
## 8
## 9
## 10
## 11
## 12
## 13
## 14
## 15
## 16
## Avenatti Kennedy Patrick Zuckerberg Pelosi Garcetti Newsom Schultz
## 1
## 2
## 3
## 4
## 5
## 6
## 7
## 8
## 9
## 10
## 11
## 12
## 13
## 14
## 15
## 16
## Kaine Johnson Kucinich Lee Scott Sinema Warner NA
## 1
## 2
## 3
## 4
## 5
## 6
## 7
## 8
## 9
## 10
## 11
## 12
## 13
## 14
## 15
## 16
## NA
## 1 Biden34%Warren18%Sanders14%Harris5%Buttigieg5%O'Rourke2%Booker2%Yang2%Klobuchar1%Delaney1%Williamson1%Ryan1%Bullock1%de Blasio1%Sestak1%Steyer1%Castro0%Gabbard0%Messam0%Bennet0%
## 2 Biden27%Warren16%Sanders15%Harris4%Buttigieg3%O'Rourke3%Yang3%Booker2%Castro1%Klobuchar1%Delaney1%Gabbard1%Williamson1%Ryan1%Bennet1%Bullock1%de Blasio1%Sestak1%Steyer1%Messam0%
## 3 Biden29%Sanders18%Warren16%Harris7%Buttigieg5%O'Rourke4%Booker3%Klobuchar2%Yang2%Bennet1%Delaney1%Steyer1%Bullock0%Castro0%de Blasio0%Gabbard0%Messam0%Ryan0%Sestak0%Williamson0%
## 4 Biden25%Warren19%Sanders15%Buttigieg8%Harris5%O'Rourke3%Yang3%Booker2%Gabbard2%Klobuchar1%Castro1%Bennet1%Williamson1%Bullock1%Delaney1%de Blasio0%Steyer0%Ryan0%Messam0%Sestak0%
## 5 Warren30%Biden24%Sanders14%Buttigieg7%Harris6%O'Rourke2%Yang2%Gabbard2%Booker1%Klobuchar1%Castro1%Steyer1%Bullock1%Williamson0%de Blasio0%Delaney0%Bennet0%Ryan0%
## 6 Biden33%Warren19%Sanders17%Harris6%Buttigieg5%O'Rourke4%Booker4%Yang3%Klobuchar1%Castro1%
## 7 Biden31%Warren25%Sanders14%Buttigieg7%Harris5%Yang4%Klobuchar2%Booker2%O'Rourke1%Gabbard1%Delaney1%Steyer1%Bennet1%de Blasio1%Castro1%Bullock0%Ryan0%Williamson0%
## 8 Biden32%Sanders20%Warren18%Harris6%Buttigieg5%O'Rourke4%Booker3%Yang3%Klobuchar2%Bullock1%Castro1%Delaney1%Gabbard1%Ryan1%Steyer1%Williamson1%Bennet0%de Blasio0%
## 9 Biden38%Warren15%Sanders14%Harris5%Buttigieg4%O'Rourke3%Yang2%Steyer2%Booker1%Castro1%Klobuchar1%Delaney1%Ryan1%Bennet1%Bullock1%de Blasio1%Gabbard0%Williamson0%Messam0%Sestak0%
## 10 Biden31%Sanders15%Warren12%Harris5%Buttigieg4%O'Rourke3%Booker2%Yang2%Ryan2%Castro1%Klobuchar1%Delaney1%Gabbard1%Williamson1%Bennet1%Bullock1%de Blasio1%Sestak1%Steyer1%Messam0%
## 11 Biden35%Sanders15%Warren15%Harris6%Buttigieg5%O'Rourke3%Yang3%Booker2%Castro1%Klobuchar1%Delaney1%Ryan1%Bennet1%Bullock1%Steyer1%Gabbard0%Williamson0%Messam0%de Blasio0%Sestak0%
## 12 Biden29%Sanders16%Warren12%Harris5%Buttigieg4%O'Rourke3%Yang3%Booker2%Castro1%Klobuchar1%Delaney1%Gabbard1%Ryan1%Bennet1%Bullock1%de Blasio1%Sestak1%Steyer1%Williamson0%Messam0%
## 13 Warren28%Biden23%Sanders15%Harris7%Buttigieg7%Yang2%O'Rourke2%Gabbard2%Booker1%Klobuchar1%Castro1%Williamson1%Ryan1%Steyer0%de Blasio0%Bullock0%Delaney0%Bennet0%
## 14 Biden30%Sanders21%Warren19%Booker4%Harris4%Buttigieg4%Klobuchar2%Gabbard2%Yang2%O'Rourke1%Castro1%Williamson1%Ryan1%Bennet0%de Blasio0%Delaney0%Steyer0%Bullock0%Messam0%Sestak0%
## 15 Biden22%Sanders16%Warren11%Buttigieg4%Harris4%Yang3%Booker3%O'Rourke2%Ryan1%Steyer1%Klobuchar1%Castro1%Gabbard1%Williamson0%Sestak0%Bullock0%Messam0%de Blasio0%Bennet0%
## 16 Biden22%Sanders16%Warren11%Harris4%Buttigieg4%Yang3%Booker3%
## [ reached 'max' / getOption("max.print") -- omitted 232 rows ]This is much better! But based on visual inspection the column headers are not properly matched. There are a few things that need to be sorted out: there are two date columns, there are commas and percents where numeric columns should be, the column headers are a little messy, and the table isn’t a tibble (this is just personal preference).
We will handle the final two issues first as they are easiest to deal with. The function clean_names() from janitor will handle the column headers, and as_tibble() will coerce the data.frame into a proper tibble. Save this semi-clean tibble into an object called polls.
polls <- session %>%
  html_node(".polls-table.tracker") %>%
  html_table(fill = TRUE) %>%
  janitor::clean_names() %>%
  as_tibble()

polls
## # A tibble: 248 x 60
## x dates pollster sample sample_2 biden sanders warren harris
## <chr> <chr> <chr> <chr> <chr> <chr> <chr> <chr> <chr>
## 1 • Sep … Sep 15-… C+Har… 768 LV 34% 14% 18%
## 2 • Sep … Sep 15-… C+Har… 1,326 RV 27% 15% 16%
## 3 • Sep … Sep 15-… AFox … 480 LV 29% 18% 16%
## 4 • Sep … Sep 14-… BYouG… 603 LV 25% 15% 19%
## 5 • Sep … Sep 13-… Civiqs 1,291 LV 24% 14% 30%
## 6 • Sep … Sep 13-… ASurv… 1,017 LV 33% 17% 19%
## 7 • Sep … Sep 13-… A-NBC… 506 LV 31% 14% 25%
## 8 • Sep … Sep 13-… B-Mor… 7,487 LV 32% 20% 18%
## 9 • Sep … Sep 10-… C+Har… 799 LV 38% 14% 15%
## 10 • Sep … Sep 10-… C+Har… 1,302 RV 31% 15% 12%
## # … with 238 more rows, and 51 more variables: buttigieg <chr>,
## # o_rourke <chr>, booker <chr>, yang <chr>, klobuchar <chr>,
## # castro <chr>, gabbard <chr>, ryan <chr>, delaney <chr>, bennet <chr>,
## # de_blasio <chr>, williamson <chr>, bullock <chr>, steyer <chr>,
## # sestak <chr>, messam <chr>, gillibrand <chr>, hickenlooper <chr>,
## # inslee <chr>, h_clinton <chr>, bloomberg <chr>, m_obama <chr>,
## # brown <chr>, moulton <chr>, gravel <chr>, swalwell <chr>, kerry <chr>,
## # abrams <chr>, holder <chr>, mc_auliffe <chr>, winfrey <chr>,
## # ojeda <chr>, trump <chr>, cuomo <chr>, avenatti <chr>, kennedy <chr>,
## # patrick <chr>, zuckerberg <chr>, pelosi <chr>, garcetti <chr>,
## # newsom <chr>, schultz <chr>, kaine <chr>, johnson <chr>,
## # kucinich <chr>, lee <chr>, scott <chr>, sinema <chr>, warner <chr>,
## # na <chr>, na_2 <chr>We want to shift over the column names to the right just once. Unfortunately there is no elegant way to do this (that I am aware of). We can see that the first column is completely useless so that can be removed. Once that column is removed we can reset the names this way they will be well aligned.
We will start by creating a vector of the original column names.
col_names <- names(polls)
col_names
## [1] "x" "dates" "pollster" "sample"
## [5] "sample_2" "biden" "sanders" "warren"
## [9] "harris" "buttigieg" "o_rourke" "booker"
## [13] "yang" "klobuchar" "castro" "gabbard"
## [17] "ryan" "delaney" "bennet" "de_blasio"
## [21] "williamson" "bullock" "steyer" "sestak"
## [25] "messam" "gillibrand" "hickenlooper" "inslee"
## [29] "h_clinton" "bloomberg" "m_obama" "brown"
## [33] "moulton" "gravel" "swalwell" "kerry"
## [37] "abrams" "holder" "mc_auliffe" "winfrey"
## [41] "ojeda" "trump" "cuomo" "avenatti"
## [45] "kennedy" "patrick" "zuckerberg" "pelosi"
## [49] "garcetti" "newsom" "schultz" "kaine"
## [53] "johnson" "kucinich" "lee" "scott"
## [57] "sinema" "warner" "na" "na_2"Unfortunately this also presents another issue. Once a column is deselected, there will be one more column name than column. So we will need to select all but the last element of the original names. We will create a vector called new_names.
# identify the integer number of the last column
last_col <- length(col_names) - 1

# create a vector which will be used for the new names
new_names <- col_names[1:last_col]
Now we can try implementing the hacky solution. Here we will deselect the first column and reset the names using setNames(). Following, we will use the mutate_at() variant to remove the percent sign from every candidate column and coerce them into integer columns. Here we will specify which variables to not mutate at within vars().
polls %>%
  select(-1) %>%
  setNames(new_names)%>%
  select(-1) %>%
  mutate_at(vars(-c("dates", "pollster", "sample", "sample_2")),
            ~as.integer(str_remove(., "%")))
## Warning in ~as.integer(str_remove(., "%")): NAs introduced by coercion## # A tibble: 248 x 58
## dates pollster sample sample_2 biden sanders warren harris buttigieg
## <chr> <chr> <chr> <chr> <int> <int> <int> <int> <int>
## 1 Sep … C+Harri… 768 LV 34 14 18 5 5
## 2 Sep … C+Harri… 1,326 RV 27 15 16 4 3
## 3 Sep … AFox Ne… 480 LV 29 18 16 7 5
## 4 Sep … BYouGov 603 LV 25 15 19 5 8
## 5 Sep … Civiqs 1,291 LV 24 14 30 6 7
## 6 Sep … ASurvey… 1,017 LV 33 17 19 6 5
## 7 Sep … A-NBC N… 506 LV 31 14 25 5 7
## 8 Sep … B-Morni… 7,487 LV 32 20 18 6 5
## 9 Sep … C+Harri… 799 LV 38 14 15 5 4
## 10 Sep … C+Harri… 1,302 RV 31 15 12 5 4
## # … with 238 more rows, and 49 more variables: o_rourke <int>,
## # booker <int>, yang <int>, klobuchar <int>, castro <int>,
## # gabbard <int>, ryan <int>, delaney <int>, bennet <int>,
## # de_blasio <int>, williamson <int>, bullock <int>, steyer <int>,
## # sestak <int>, messam <int>, gillibrand <int>, hickenlooper <int>,
## # inslee <int>, h_clinton <int>, bloomberg <int>, m_obama <int>,
## # brown <int>, moulton <int>, gravel <int>, swalwell <int>, kerry <int>,
## # abrams <int>, holder <int>, mc_auliffe <int>, winfrey <int>,
## # ojeda <int>, trump <int>, cuomo <int>, avenatti <int>, kennedy <int>,
## # patrick <int>, zuckerberg <int>, pelosi <int>, garcetti <int>,
## # newsom <int>, schultz <int>, kaine <int>, johnson <int>,
## # kucinich <int>, lee <int>, scott <int>, sinema <int>, warner <int>,
## # na <int>Now we must tidy the data. We will use tidyr::gather() to transform the data from wide to long. In short, gather takes the column headers (the key argument) and creates a new variable from the values of the columns (the value argument). In this case, we will create a new column called candidate from the column headers and a second column called points which are a candidates polling percentage. Next we deselect any columns that we do not want to be gathered.
polls %>%
  select(-1) %>%
  setNames(new_names)%>%
  select(-1) %>%
  mutate_at(vars(-c("dates", "pollster", "sample", "sample_2")),
            ~as.integer(str_remove(., "%"))) %>%
  gather(candidate, points, -dates, -pollster, -sample, -sample_2)
## Warning in ~as.integer(str_remove(., "%")): NAs introduced by coercion## # A tibble: 13,392 x 6
## dates pollster sample sample_2 candidate points
## <chr> <chr> <chr> <chr> <chr> <int>
## 1 Sep 15-18, 2… C+HarrisX 768 LV biden 34
## 2 Sep 15-18, 2… C+HarrisX 1,326 RV biden 27
## 3 Sep 15-17, 2… AFox News 480 LV biden 29
## 4 Sep 14-17, 2… BYouGov 603 LV biden 25
## 5 Sep 13-16, 2… Civiqs 1,291 LV biden 24
## 6 Sep 13-16, 2… ASurveyUSA 1,017 LV biden 33
## 7 Sep 13-16, 2… A-NBC News/Wall Street J… 506 LV biden 31
## 8 Sep 13-15, 2… B-Morning Consult 7,487 LV biden 32
## 9 Sep 10-13, 2… C+HarrisX 799 LV biden 38
## 10 Sep 10-13, 2… C+HarrisX 1,302 RV biden 31
## # … with 13,382 more rowsThere are a few more house-keeping things that need to be done to improve this data set. sample_2 is rather uninformative. On the FiveThirtyEight website there is a key which describes what these values represent (A = ADULTS, RV = REGISTERED VOTERS, V = VOTERS, LV = LIKELY VOTERS). This should be specified in our data set. In addition the sample column ought to be cast into an integer column. And finally, those messy dates will need to be cleaned. My approach to this requires creating a function to handle this cleaning. First, the simple stuff.
To do the first two above steps, we will continue our function chain and save it to a new variable polls_tidy.
polls_tidy <- polls %>%
  select(-1) %>%
  setNames(new_names)%>%
  select(-1) %>%
  mutate_at(vars(-c("dates", "pollster", "sample", "sample_2")),
            ~as.integer(str_remove(., "%"))) %>%
  gather(candidate, points, -dates, -pollster, -sample, -sample_2) %>%
  mutate(sample_2 = case_when(
    sample_2 == "RV" ~ "Registered Voters",
    sample_2 == "LV" ~ "Likely Voters",
    sample_2 == "A" ~ "Adults",
    sample_2 == "V" ~ "Voters"
  ),
  sample = as.integer(str_remove(sample, ",")))
## Warning in ~as.integer(str_remove(., "%")): NAs introduced by coercionpolls_tidy## # A tibble: 13,392 x 6
## dates pollster sample sample_2 candidate points
## <chr> <chr> <int> <chr> <chr> <int>
## 1 Sep 15-18, … C+HarrisX 768 Likely Voters biden 34
## 2 Sep 15-18, … C+HarrisX 1326 Registered V… biden 27
## 3 Sep 15-17, … AFox News 480 Likely Voters biden 29
## 4 Sep 14-17, … BYouGov 603 Likely Voters biden 25
## 5 Sep 13-16, … Civiqs 1291 Likely Voters biden 24
## 6 Sep 13-16, … ASurveyUSA 1017 Likely Voters biden 33
## 7 Sep 13-16, … A-NBC News/Wall Stre… 506 Likely Voters biden 31
## 8 Sep 13-15, … B-Morning Consult 7487 Likely Voters biden 32
## 9 Sep 10-13, … C+HarrisX 799 Likely Voters biden 38
## 10 Sep 10-13, … C+HarrisX 1302 Registered V… biden 31
## # … with 13,382 more rows6.2.1 Date cleaning
Next we must work to clean the date field. I find that when working with a messy column, creating a single function which handles the cleaning is one of the most effective approaches. Here we will create a function which takes a value provided from the dates field and return a cleaned date. There are two unique cases I identified. There are poll dates which occurred during a single month, or a poll that spanned two months. The dates are separated by a single hyphen -. If we split the date at - we will either receive two elements with a month indicated or one month with a day and a day number. In the latter case we will have to carry over the month. Then the year can be appended to it and parsed as a date using the lubridate package. For more on lubridate visit here.
The function will only return one date at a time. The two arguments will be date and .return to indicate whether the first or second date should be provided. The internals of this function rely heavily on the stringr package (see R for Data Science Chapter 14). switch() at the end of the function determines which date should be returned (see Advanced R Chapter 5).
clean_date <- function(date, .return = "first") {
  # take date and split at the comma to get the year and the month-day combo
  date_split <- str_split(date, ",") %>%
    # remove from list / coerce to vector
    unlist() %>%
    # remove extra white space
    str_trim()

  # extract the year
  date_year <- date_split[2]

  # split the month day portion and coerce to vector
  dates <- unlist(str_split(date_split[1],  "-"))

  # paste the month day and year together then parse as date using `mdy()`
  first_date <- paste(dates[1], date_year) %>%
    lubridate::mdy()

  second_date <- ifelse(!str_detect(dates[2], "[A-z]+"),
                        yes = paste(str_extract(dates[1], "[A-z]+"),
                              dates[2],
                              date_year),
                        no = paste(dates[2], date_year)) %>%
    lubridate::mdy()

  switch(.return,
         first = return(first_date),
         second = return(second_date)
         )

}

# test on a date
clean_date(polls_tidy$dates[10], .return = "first")
## [1] "2019-09-10"clean_date(polls_tidy$dates[10], .return = "second")## [1] "2019-09-13"We can use this new function to create two new columns poll_start and poll_end using mutate(). Following this we can deselect the original dates column, remove any observations missing a points value, remove duplicates using distinct(), and save this to polls_clean.
polls_clean <- polls_tidy %>%
  mutate(poll_start = clean_date(dates, "first"),
         poll_end = clean_date(dates, "second")) %>%
  select(-dates) %>%
  filter(!is.na(points)) %>%
  distinct()

polls_clean
## # A tibble: 4,911 x 7
## pollster sample sample_2 candidate points poll_start poll_end
## <chr> <int> <chr> <chr> <int> <date> <date>
## 1 C+HarrisX 768 Likely Vo… biden 34 2019-09-15 2019-09-18
## 2 C+HarrisX 1326 Registere… biden 27 2019-09-15 2019-09-18
## 3 AFox News 480 Likely Vo… biden 29 2019-09-15 2019-09-18
## 4 BYouGov 603 Likely Vo… biden 25 2019-09-15 2019-09-18
## 5 Civiqs 1291 Likely Vo… biden 24 2019-09-15 2019-09-18
## 6 ASurveyUSA 1017 Likely Vo… biden 33 2019-09-15 2019-09-18
## 7 A-NBC News/Wal… 506 Likely Vo… biden 31 2019-09-15 2019-09-18
## 8 B-Morning Cons… 7487 Likely Vo… biden 32 2019-09-15 2019-09-18
## 9 C+HarrisX 799 Likely Vo… biden 38 2019-09-15 2019-09-18
## 10 C+HarrisX 1302 Registere… biden 31 2019-09-15 2019-09-18
## # … with 4,901 more rows6.2.2 Visualization
The cleaned data can be aggregated and visualized.
avg_polls <- polls_clean %>%
  group_by(candidate) %>%
  summarise(avg_points = mean(points, na.rm = TRUE),
            min_points = min(points, na.rm = TRUE),
            max_points = max(points, na.rm = TRUE),
            n_polls = n() - sum(is.na(points))) %>% # identify how many polls candidate is in
  # remove candidates who appear in 50 or fewer polls: i.e. HRC
  filter(n_polls > 50) %>%
  arrange(-avg_points)

avg_polls
## # A tibble: 26 x 5
## candidate avg_points min_points max_points n_polls
## <chr> <dbl> <int> <int> <int>
## 1 biden 29.7 9 46 242
## 2 sanders 17.5 4 36 247
## 3 warren 11.6 2 43 246
## 4 harris 8.39 2 21 247
## 5 buttigieg 5.17 0 21 218
## 6 o_rourke 4.40 0 21 240
## 7 booker 2.66 0 9 243
## 8 yang 1.60 0 5 197
## 9 klobuchar 1.34 0 5 228
## 10 castro 1.12 0 12 234
## # … with 16 more rowsavg_polls %>%
mutate(candidate = fct_reorder(candidate, avg_points)) %>%
ggplot(aes(candidate, avg_points)) +
geom_col() +
theme_minimal() +
coord_flip() +
labs(title = "Polls Standings", x = "", y = "%")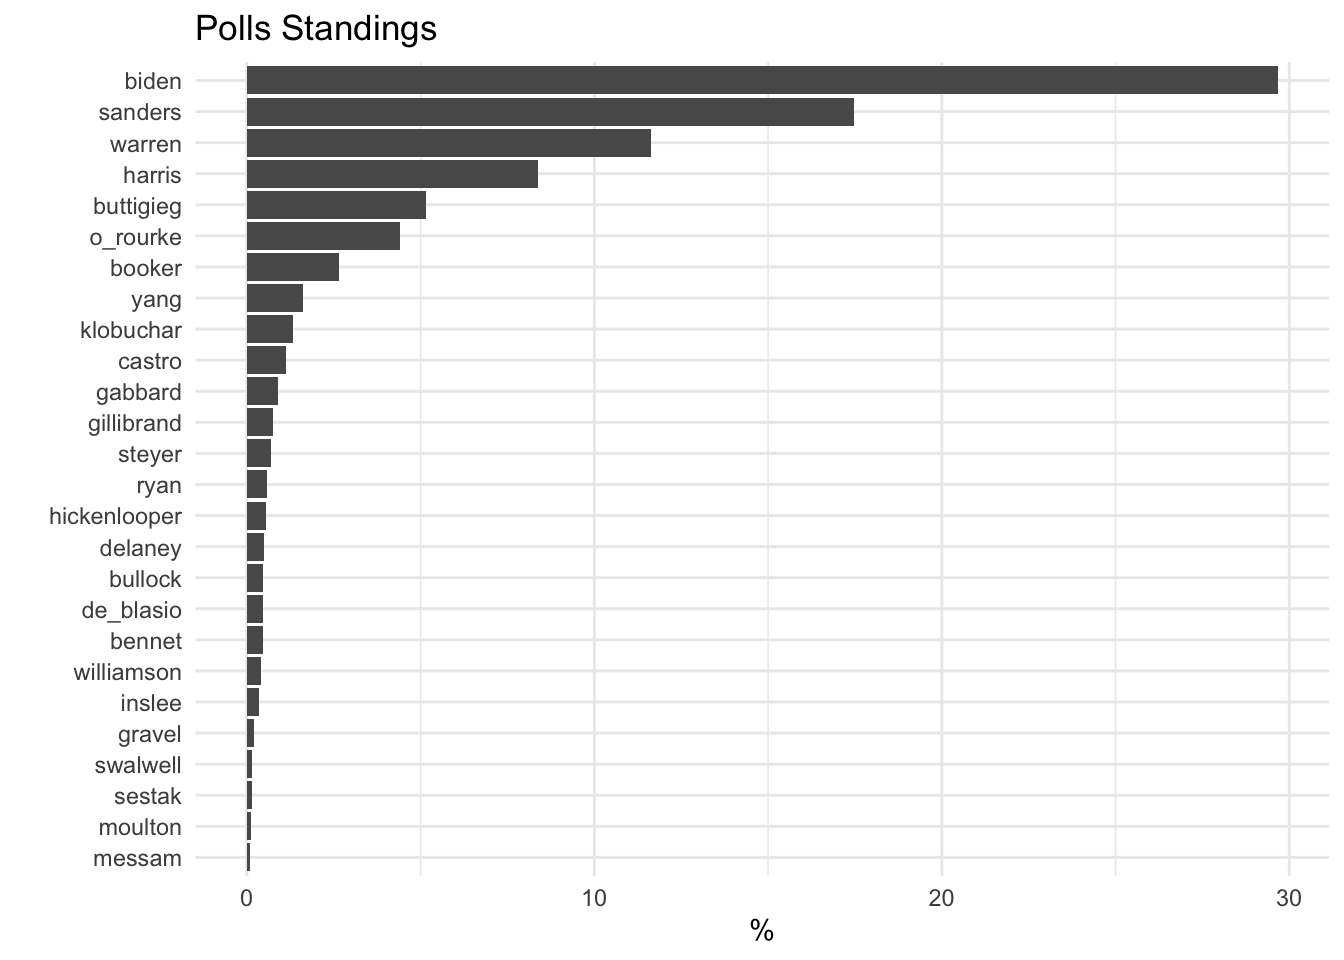
6.3 Creating historic polling data
It may become useful to have a running history of how candidates have been polling. We can use R to write a csv file of the data from FiveThirtyEight. However, what happens when the polls update? How we can we keep the previous data and the new data? We will work through an example using a combination of bind_rows() and distinct(). I want to emphasize that this is not a good practice if you need to scale to hundreds of thousand of rows. This works in this case as the data are inherently small.
To start, I have created a sample dataset which contains 80% of these polls (maybe less by the time you do this!). Note that is probably best to version control this or have multiple copies as a failsafe.
The approach we will take is to read in the historic polls data set and bind rows with the polls_clean data we have scraped. Next we remove duplicate rows using distinct().
old_polls <- read_csv("data/polls.csv")## Parsed with column specification:
## cols(
## pollster = col_character(),
## sample = col_double(),
## sample_2 = col_character(),
## candidate = col_character(),
## points = col_double(),
## poll_start = col_date(format = ""),
## poll_end = col_date(format = "")
## )old_polls## # A tibble: 1,564 x 7
## pollster sample sample_2 candidate points poll_start poll_end
## <chr> <dbl> <chr> <chr> <dbl> <date> <date>
## 1 C+HarrisX 370 Registered… klobuchar 2 2019-06-06 2019-06-10
## 2 C+HarrisX 448 Registered… gillibra… 1 2019-06-06 2019-06-10
## 3 B-Morning Con… 11627 Likely Vot… harris 13 2019-06-06 2019-06-10
## 4 B-Morning Con… 699 Registered… delaney 0 2019-06-06 2019-06-10
## 5 C+HarrisX 743 Registered… williams… 1 2019-06-06 2019-06-10
## 6 A-Quinnipiac … 559 Registered… gabbard 0 2019-06-06 2019-06-10
## 7 B-Morning Con… 14250 Likely Vot… gillibra… 2 2019-06-06 2019-06-10
## 8 A-Quinnipiac … 559 Registered… gillibra… 0 2019-06-06 2019-06-10
## 9 B-Morning Con… 14250 Likely Vot… harris 6 2019-06-06 2019-06-10
## 10 A+Monmouth Un… 330 Registered… warren 8 2019-06-06 2019-06-10
## # … with 1,554 more rowsupdated_polls <- bind_rows(old_polls, polls_clean) %>%
distinct()
updated_polls## # A tibble: 6,475 x 7
## pollster sample sample_2 candidate points poll_start poll_end
## <chr> <dbl> <chr> <chr> <dbl> <date> <date>
## 1 C+HarrisX 370 Registered… klobuchar 2 2019-06-06 2019-06-10
## 2 C+HarrisX 448 Registered… gillibra… 1 2019-06-06 2019-06-10
## 3 B-Morning Con… 11627 Likely Vot… harris 13 2019-06-06 2019-06-10
## 4 B-Morning Con… 699 Registered… delaney 0 2019-06-06 2019-06-10
## 5 C+HarrisX 743 Registered… williams… 1 2019-06-06 2019-06-10
## 6 A-Quinnipiac … 559 Registered… gabbard 0 2019-06-06 2019-06-10
## 7 B-Morning Con… 14250 Likely Vot… gillibra… 2 2019-06-06 2019-06-10
## 8 A-Quinnipiac … 559 Registered… gillibra… 0 2019-06-06 2019-06-10
## 9 B-Morning Con… 14250 Likely Vot… harris 6 2019-06-06 2019-06-10
## 10 A+Monmouth Un… 330 Registered… warren 8 2019-06-06 2019-06-10
## # … with 6,465 more rowsNow you have a cleaned data set which has been integrated with the recently scraped data. Write this to a csv using write_csv() for later use.